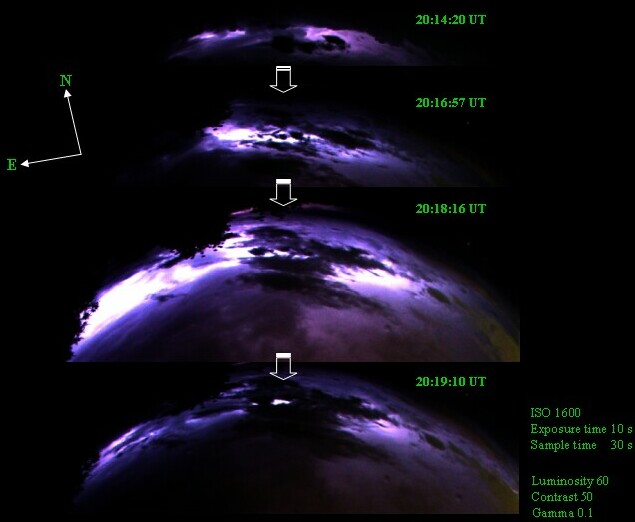
An attempt to use the all-sky camera for the lightening detection in the troposphere was made during the AMMA campaign 2006, dedicated to study the thunderstorm development in Africa. Designed as mobile and independent, the camera was completed with the sound card and the LCD counter in order to get the additional information concerning the altitude of the observed emissions.
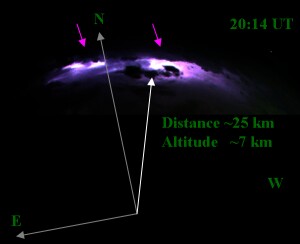
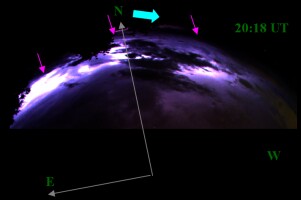
Lightening events are seen at ~ 25 km northward from the observation point, the estimated altitude is ~7 km
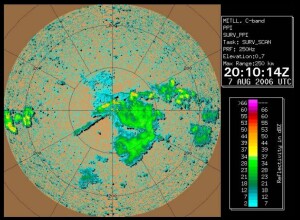
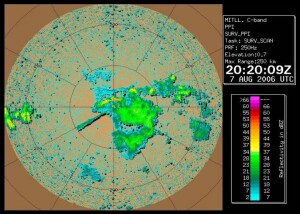
MIT: Frequency: 250 Hz Sample time: 10 min
ALFA: Exposure time: 10 s Sample time: 30 s
Having smaller spatial covering (~100 km with respect to 250 km), the all-sky camera has better spatial (7 m at zenith and 280 m at horizon with respect to few hundred meters) and temporal (30 s with respect to 10 min) resolution than that of the MIT radars. Both instruments observe 2 regions of the lightening at ~ 25 km in the north-west sector, which are progressively extended toward the west. The north-east lightening at 50 and 100 km are also seen in the radar’s maps and ALFA’s images.
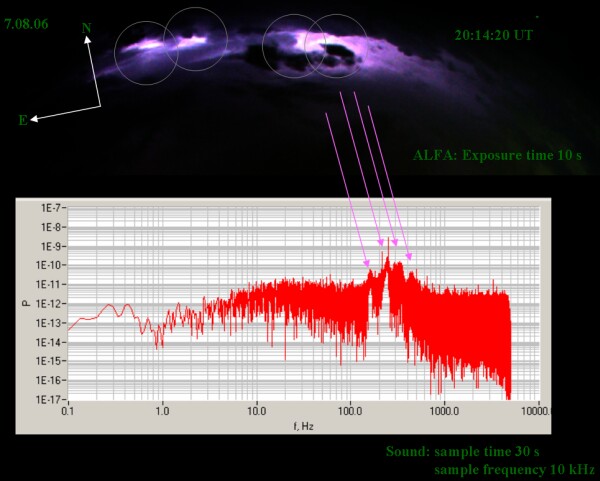
Each lightening is associated with an acoustic wave propagating away the discharge segments. The discharge force, lightening altitude, wind speed in the troposphere and the propagation direction determine the dominant frequency of the acoustic wave when it reaches the observer.
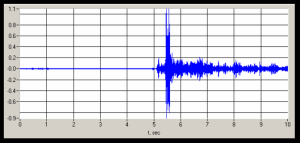
Time variation of the sound following a lightening event
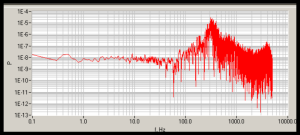
Corresponding frequency spectrum with the dominant frequency of ~300 Hz